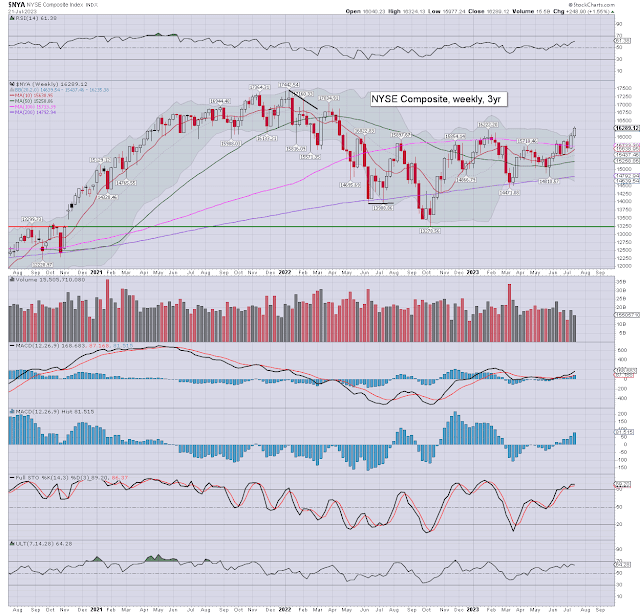
It was a bullish week for most US equity indexes, with net weekly changes, ranging from +2.6% (Trans), +2.1% (Dow), +1.5% (NYSE comp', R2K), +0.7% (SPX), to -0.6% (Nasdaq comp').
Lets take our regular look at six of the main US indexes
sp'500
Nasdaq comp'
Dow
R2K
NYSE comp'
Trans
–
Summary
Five US equity indexes settled net higher for the week, with one net lower.
The Transports lead the way up, whilst the Nasdaq was moderately lower.
–
Looking ahead
An extremely busy week is ahead, with a monster truck load of earnings, some key econ-data, and a meeting of the monetary maniacs at Print Central.
Earnings:
M - DPZ, PHG, CLF, NXPI, WHR, LOGI, FFIV
T - VZ, GM, MMM, GE, SPOT, LW, NUE, RTX, NEE, ALK, MSFT, GOOGL, SNAP, V, PACW, TDOC, CALM, TXN, EQT, WFRD
W - T, BA, KO, TLRY, TMO, HLT, ADP, UNP, GD, META, CMG, NOW, LRCX, ENVX, EBAY, MAT, WH
T - RCL, MCD, LUV, MA, CROX, VLO, ABBC, BMY, HON, ENPH, F, INTC, ROKU, FSLR, TMUS, X, SKX
F - XOM, CVX, PG, CNC, AZN, CL, NWL
-
Econ-data/events
M - PMI manu', PMI serv'
T - Case-Shiller HPI, consumer con'
W - New home sales, EIA Pet'
*FOMC 2pm, Press conf' 2.30pm
T - GDP Q2 (print 1), Weekly jobs, durable goods orders, intl' trade, pending home sales
F - Pers' income/spending, PCE, employment cost, consumer sent'
-
Final note
With a new cycle high of SPX 4578, it was just another week for the equity bulls. Almost everyone is bullish equities, with most (not least US T-Sec' Yellen, and the Cramer clown) confident of an economic 'soft landing', or no recession at all.
Now, go stare at this for a good while...
Wednesday's multi-month high is from the intersection of two sets of upper channel/trends.
Ohh, and yes... such lines are highly dependent on the 'style' of the chartist, and also whether the chart is log scale or linear. In this chart, the scale is log'.
The initial pull back from resistance is a little 'curious' though, don't you think?
Clearly though, even the most macro-bearish have to accept there is currently ZERO sign of a m/t ceiling/turn. Even if rising trend (currently 4340s) from 3808 is broken, the bulls need have no sleepless nights unless we trade <4100.
For the 'serious/big money', 4100, and/or the 200dma (4052) makes for a very conservative threshold to stay m/t bullish.
I'd accept the s/t bears could short with a stop from around Wednesday's high. Personally, I'd like to see <4300. Further, this is just one index, and I'd always take into consideration other world markets.
For the record, I don't expect any 'market drama' this side of Labor day. Whilst Sept>Oct' does favour the bears, I'm not expecting much right now. At best, perhaps a test of rising trend (from Oct'2022), which as of mid Oct'2023 will be around 4250.
Now, get back to staring at the above chart.
Summer subscription offers, see: https://www.tradingsunset.com
Have
a good weekend
--
*the next post on this page will likely appear 4.20pm EST on Monday.


